Independent project: Data application
CityOps: NYC 311 operations intelligence
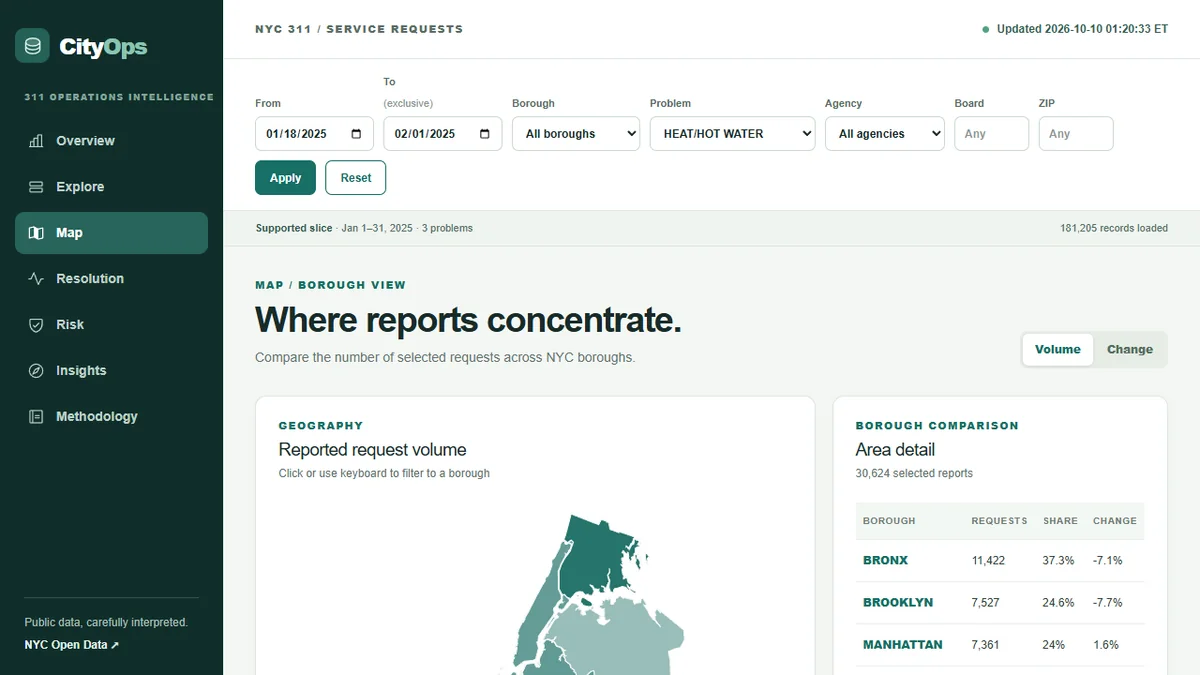
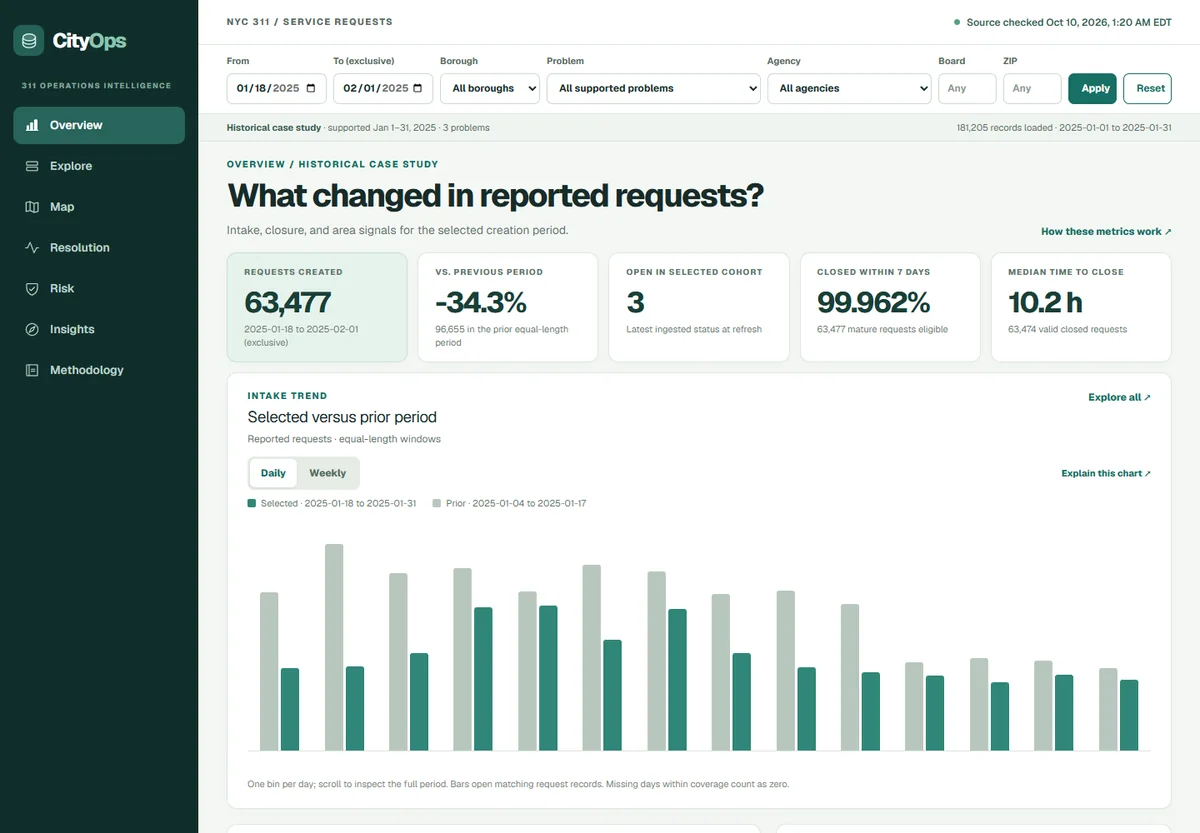
A read-only dashboard for investigating what New York residents report to 311, how quickly requests close, and where seven-day risk prediction stops being trustworthy. It covers 181,205 requests from January 2025 for three complaint types, and it withholds a risk ranking the data cannot support.
What it is
311 counts are reports received, not confirmed incidents, and a raw borough count mostly reflects population and reporting habits. CityOps is built around saying so: every chart has a definition drawer, the page shows the source range and the last actual refresh, and it never claims live data.
The first release imports January 1 to 31, 2025 for Noise - Residential, HEAT/HOT WATER and Illegal Parking. The default view compares January 18 to 31 with the 14 days before it.
The project also tests whether seven-day risk can be predicted. It could not: the held-out test had only three positive outcomes and the logistic regression did not beat the grouped baseline, so the public ranking is withheld and the model card says why. It has no hosted demo or refresh schedule.
My part
I built the ingestion pipeline, the API, the dashboard and the modeling experiment.
Independent project, not an official New York City system. It runs locally and has no hosted demo or refresh schedule.
Stack
- Next.js
- NestJS
- PostgreSQL
- GraphQL
- Python
- scikit-learn
- Playwright
- Docker Compose
What is inside
An ingestion job, a NestJS API and a Next.js dashboard around one PostgreSQL database, with a separate Python experiment.
01
Staged ingestion
Requests are pulled from the NYC SODA API in stages, reconciled against daily source counts, then published transactionally with upserts, quality flags and run records, so repeating a range never duplicates requests.
02
One metric service
The NestJS API exposes REST with Swagger and GraphQL, and both use the same metric service. Filters are validated and bounded, pagination is keyset-based and CSV export is capped.
03
Investigation dashboard
URL-persisted filters, aligned current and prior trends, problem momentum, a borough problem mix and a borough map, with keyboard and focus handled by Radix Dialog.
04
Model experiment
A grouped baseline and a logistic regression are evaluated on a chronological holdout under a feature-leakage contract. The Risk page shows the measured held-out results.