M.S. Computer Science (thesis track), University of Georgia, 2026
My thesis, explained
Multimodal Self-Supervised Activity Recognition on CASAS Smart-Home Sensor Streams
A smart home can tell what a resident is doing without a camera, just from motion and door sensors clicking on and off. My thesis asks how best to read those sparse event logs, and finds that the answer depends on the house.
PDF, 58 pages, 2.2 MB. Advisor: Fei Dou.
01
The short version
The data are timestamped sensor events from four public CASAS homes: a kitchen sensor turns on, a hallway sensor fires a moment later, a door opens. There is no video and nothing worn, which is good for privacy but makes the signal thin and irregular.
I cut each stream into windows of 30 events and turned every window into four different views: an ordered sequence, a short text summary, an image on the floor plan, and a graph. Each view is read by its own neural network, and a small Transformer combines them.
The headline result is that no single view wins everywhere. The best model for each home used a different combination of views, and the thesis shows why a single score would have hidden that.
4
CASAS homes
Aruba, Cairo, Kyoto and Milan
4
views of each window
sequence, text, image and graph
30
events per window
stride of 15, so windows overlap
3
random seeds
every result is a mean over seeds 10, 30 and 50
02
Why it is hard
Recognising what someone is doing from ambient sensors is harder than it sounds.
Sparse, irregular events
A window of 30 events can span seconds during cooking or many minutes at night. The data are discrete events, not a steady signal.
Ambiguity
Kitchen sensors can mean cooking, eating, taking medicine or just walking through. Evidence for different activities overlaps.
Class imbalance
Common background behaviour vastly outnumbers rare but important events such as taking medicine or getting up at night, so a model can score well and still miss them.
Every house is different
Sensor sets, floor plans and residents differ: Aruba has one resident and 34 sensors, Cairo has two residents and no door sensors, Kyoto has the richest set, Milan has ten activity classes.
03
Four views of the same 30 events
The idea is that the views are not copies of each other. Each one makes a different kind of evidence easy to see.
Sensor log
- Timestamped motion and door events
- One house, one metadata file
Event windows
- 30 events, stride 15
- Windows never mix activity labels
Four derived views
- Sequence of event features
- Deterministic text summary
- Floor-plan raster image
- Event graph
Encoders
- Transformer
- Transformer
- CNN
- Graph network
Fusion and classifier
- Fusion transformer
- Auxiliary heads per view
- Activity label
The pipeline for one window. Simplified from the thesis.
Sequence
The 30 events in order, each with its sensor, state, time since the window started, the gap before it and the time of day.
Good at: Order and timing, for example leaving home versus coming back.
Text
A deterministic written summary of the window: time of day, weekday or weekend, dominant room, pace, room-to-room moves and per-sensor counts. No language model writes it.
Good at: Context that survives small changes in event order.
Image
A 96 by 96 picture on the house floor plan showing where sensors fired, how often, and whether early or late in the window, blurred into a heat map.
Good at: Where things happened, which separates many activities better than counts do.
Graph
Events as nodes, linked to the physical sensors they came from, with edges for order, repeated sensors and events close in time.
Good at: Repeated sensors and neighbourhood structure, even in a house with no door sensors.
04
How it works
Shared windows and splits
All models, mine and the baselines, start from the same windows and the same train and test split. Differences in the results are therefore differences in how a window is represented and learned, not in how it was cut.
Four views, four encoders
A Transformer reads the sequence, a small Transformer reads the text, a convolutional network reads the image and a graph network reads the graph. Each produces a 256-number summary.
Self-supervised pretraining
Without using any labels, the encoders learn that the four views of one window belong together and that views of other windows do not (contrastive learning). The sequence encoder also learns to guess hidden sensor names.
Fusion
A two-layer Transformer combines the active views. Each view also keeps its own small classifier, and learned per-class weights decide how much each class trusts each view. Confident views are given more say.
Fine-tuning for rare activities
Training handles imbalance with weighted sampling, class weights and focal loss, and keeps the checkpoint with the best validation macro-F1 so rare activities are not ignored.
05
What I found
Weighted F1 is the main score. It follows the test set's real mix of activities. All numbers are means over three seeds.
| House | Best proposed model | Weighted F1 | Macro F1 | Best baseline (weighted F1) |
|---|---|---|---|---|
| Aruba | Graph, image and sequence | 0.850 | 0.735 | SICA 0.847 |
| Cairo | Graph, text and image | 0.842 | 0.524 | SICA 0.755 |
| Kyoto | Image, text and sequence | 0.843 | 0.766 | SICA 0.821 |
Baselines are SICA, CPC, DeepCASAS and DCNN, from the literature. Only the best baseline for each house is shown here.
Milan
Milan is the hardest home, with ten activity classes that mostly happen in the same few rooms. Its strongest proposed model used all four views, and the thesis reports that model as the best balanced one by macro F1, ahead of the strongest baseline. The thesis tables for Milan are in the PDF.
No one view wins
Aruba did best with graph, image and sequence together. Cairo, with no door sensors, did best with graph, text and image. Kyoto, with rich floor-plan zones, did best with image, text and sequence. Milan needed all four. The best set of views differs by house, and adding a view does not always help.
One score can hide the failure
Weighted F1 and accuracy reward getting the common activities right. Macro F1 gives every activity equal weight. Cairo scores 0.842 weighted but only 0.524 macro, because rare activities are still hard. For monitoring, the rare activities can be the ones that matter.
Some confusions are real
The worst errors cluster where activities share the same room, sensors and rhythm, such as eating, cooking and taking medicine in a kitchen. There, intent is not visible in the sensor evidence.
06
The tools around the model
Part of the thesis is the research software that made the experiments repeatable.
One-file experiment configuration
A single short intent file sets house, window size, stride and seeds, and the rest of the configuration is derived from it, so changing the window size changes everything consistently.
Sensor annotation tool
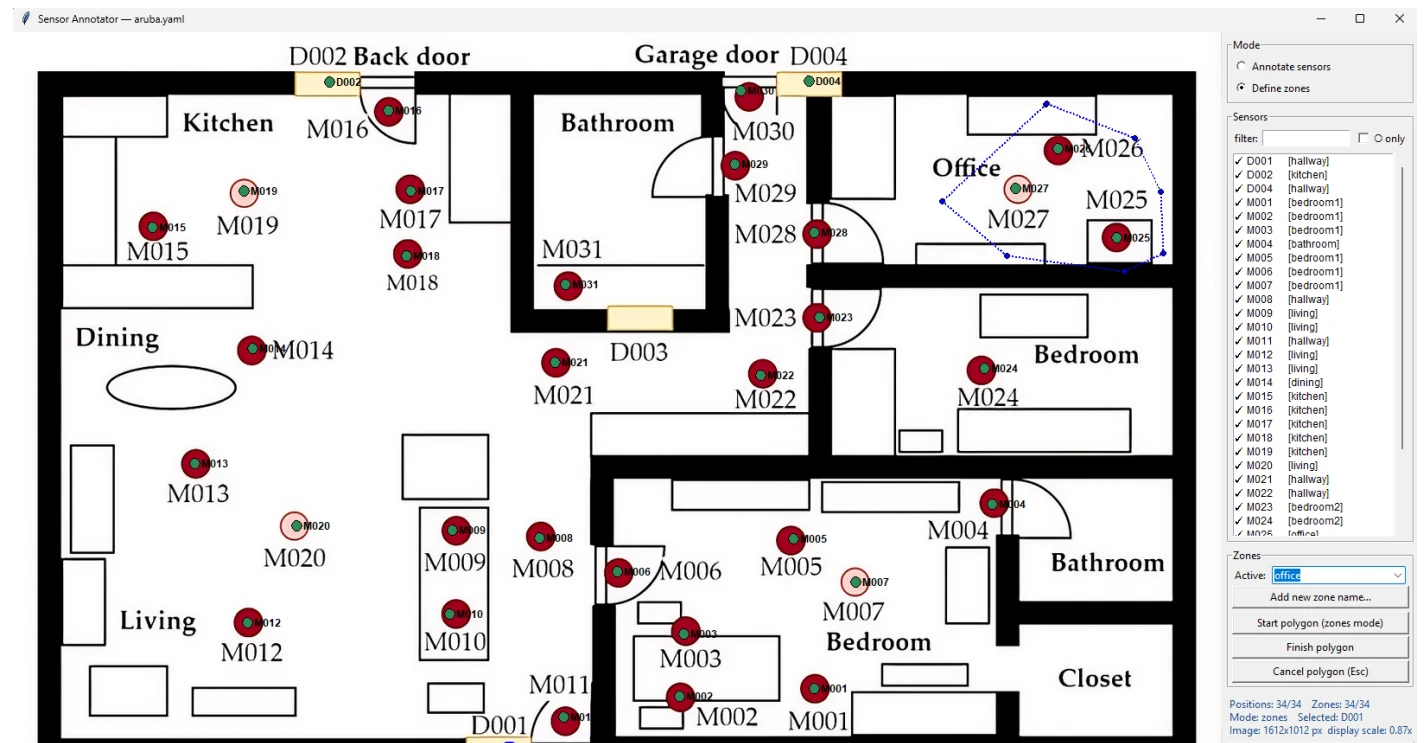
A graphical tool for placing sensors on a floor plan and drawing zones as polygons, which writes the metadata the image and graph views need. A new house can be added with a visual pass instead of custom code.
Smart-home playback simulator
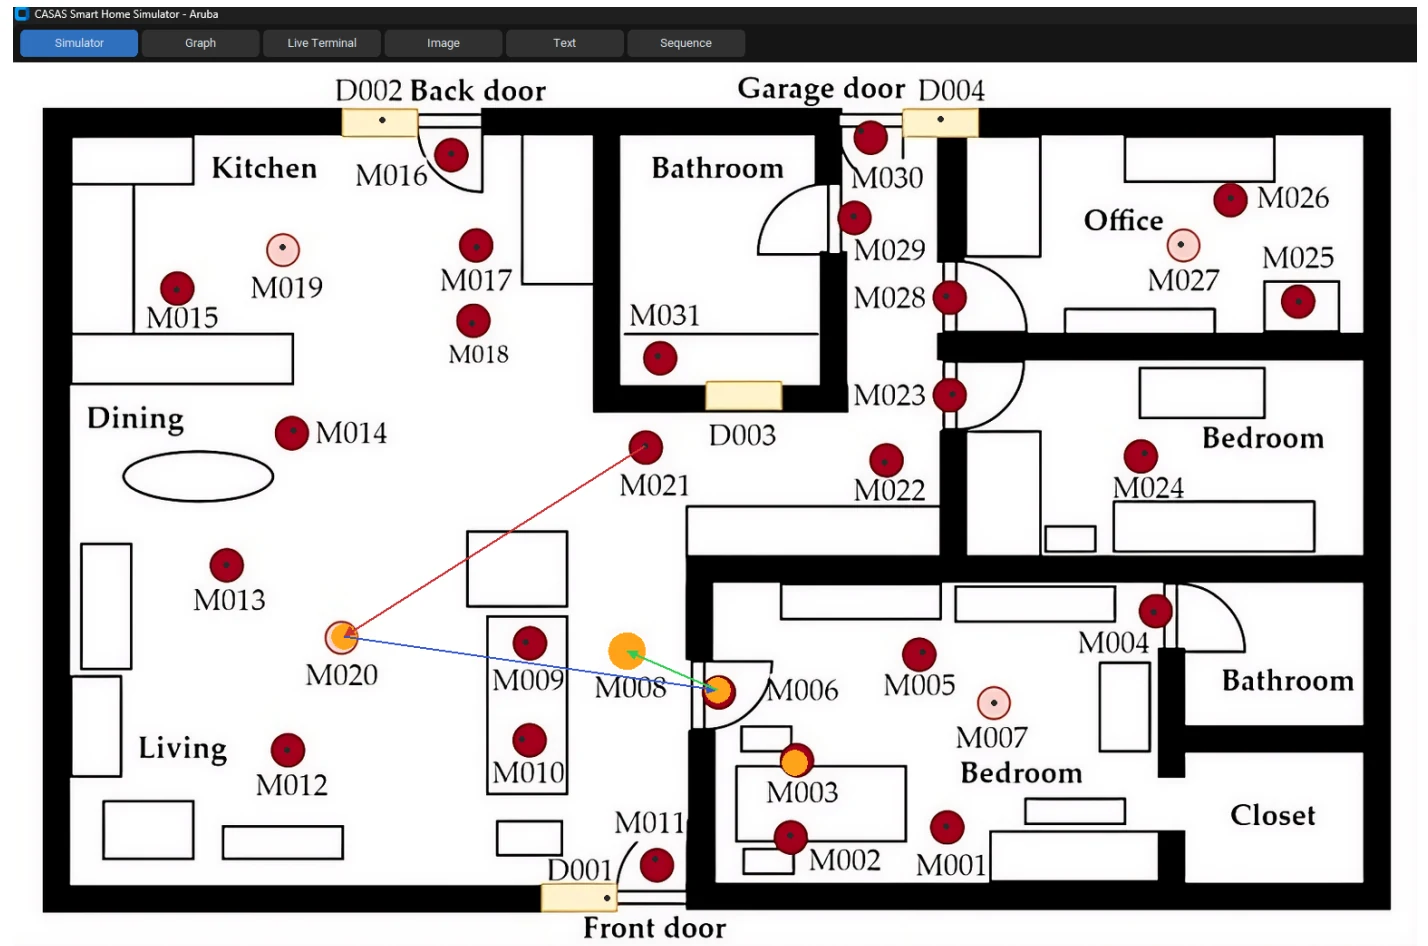
Replays the raw event log over the floor plan and shows the four views of the current window, used to check that the pipeline is doing what it should.
Try an interactive version of the playback idea, on synthetic data
07
Limits and next steps
Limitations
- Activity labels are not identical across houses (nine, seven and ten classes), so macro F1 values should be compared across houses with care.
- Rare activities have little support, so their scores shift with the split and the seed.
- Some figures show validation-style diagnostics while the tables show test-set means.
- The annotation and simulator tools were not evaluated in a user study.
Future work
- Study window lengths beyond 10 and 30 events, and how each activity changes as context grows.
- Analyse the learned per-class weights to see which activities trust which view.
- Add objectives aimed at rare activities such as taking medicine and getting up at night.
- Test on more CASAS homes and on moving to a new resident or house.
The full thesis
Read it in full
This page is a plain-language summary. The PDF has the full method, every table and the references. It is the thesis as submitted to the University of Georgia Graduate School.
58 pages, 2.2 MB